China Top 10 Kitchen Utensils Set Suppliers?
Choosing reliable Kitchen Utensils Set suppliers in China requires more than browsing attractive product photos. A polished catalog can hide inconsistent materials, weak packaging, or slow communication. This guide introduces ten suppliers that deserve closer attention from importers, retailers, hospitality buyers, and private-label brands.
The evaluation considers product range, manufacturing experience, material options, customization, quality control, export support, and customer feedback. Stainless steel grades, silicone heat resistance, wooden handle finishing, and food-contact documentation all matter. So does the small stuff. A cracked spatula, loose rivet, or poorly printed carton can damage an entire shipment’s value. Suppliers with clear specifications and traceable production processes generally offer safer purchasing decisions.
No ranking is completely neutral. Buyer requirements differ. A restaurant may prioritize heavy-duty performance, while a homeware brand may need elegant colors and compact packaging. Minimum order quantities, sample policies, lead times, and payment terms can also change the final choice. Some suppliers appear strong online but provide limited technical details. That deserves caution. We also recognize that public information may become outdated, so direct verification remains essential. Request current catalogs, factory photos, test reports, and samples before signing an agreement. A practical comparison can reveal which China-based suppliers match your budget, market position, and quality expectations. Reliable sourcing is rarely dramatic. It is usually careful, specific, and repeatable.
China’s Kitchen Utensil Market: 2023 Trade Data from UN Comtrade
China’s kitchen utensil market remained a major sourcing base in 2023, according to UN Comtrade records. The data shows strong international movement across metal cookware, tableware, and household kitchen articles. However, “kitchen utensils” is not one perfectly defined customs category. Analysts often review several HS codes, including stainless-steel articles, aluminum goods, and cutlery. Different code selections can change the ranking.
The numbers need reading. UN Comtrade can show China’s export value, volume, destination, and annual growth, but it does not identify the best ten factories by itself. A practical supplier review should combine trade data with factory audits, production samples, material certificates, and order records. Stainless steel grade matters. So do handle welding, edge finishing, packaging strength, and tolerance control. These details become visible only after direct verification.
For buyers comparing China’s top ten kitchen utensil set suppliers, the 2023 data offers a useful market map rather than a final shortlist. High export value may indicate scale, but it can also reflect higher-priced product mixes. Large shipment volume may hide thin margins or inconsistent quality. That is a weakness in my own reading of trade statistics. I would compare three years of data, inspect shipment destinations, and separate cookware from cutlery before judging supplier capability. Some records may also reflect trading companies instead of manufacturers. Supplier location, factory capacity, and response quality still require careful checking.
China Top 10 Kitchen Utensils Set Suppliers? - China’s Kitchen Utensil Market: 2023 Trade Data from UN Comtrade
| Rank | Destination Market | China Export Value
(US$ million) | Share of Listed Exports | Estimated Export Volume
(tonnes) | Main Product Groups |
| 1 | United States | 1,850 | 32.1% | 382,000 | Plastic tableware, stainless-steel utensils, aluminium kitchenware |
| 2 | Japan | 730 | 12.7% | 119,000 | Metal cutlery, household articles of iron or steel, plastic utensils |
| 3 | Germany | 610 | 10.6% | 92,000 | Stainless-steel cutlery, aluminium kitchen articles, plastic kitchenware |
| 4 | United Kingdom | 480 | 8.3% | 78,000 | Kitchen utensils of base metal, plastic tableware, cutlery sets |
| 5 | Australia | 420 | 7.3% | 71,000 | Plastic kitchenware, stainless-steel utensils, aluminium articles |
| 6 | France | 390 | 6.8% | 65,000 | Metal cutlery, plastic tableware, household kitchen articles |
| 7 | Canada | 370 | 6.4% | 70,000 | Plastic kitchen utensils, stainless-steel kitchenware, cutlery |
| 8 | Netherlands | 330 | 5.7% | 51,000 | Plastic tableware, metal utensils, household articles |
| 9 | South Korea | 300 | 5.2% | 43,000 | Stainless-steel cutlery, aluminium kitchenware, plastic utensils |
| 10 | Italy | 280 | 4.9% | 39,000 | Metal kitchen utensils, cutlery, plastic household articles |
| Total of Listed Markets | 5,760 | 100.0% | 1,010,000 | Selected destination markets |
Data scope: China-origin exports in selected kitchen-utensil and kitchenware classifications, including HS 3924, 7323, 7615 and 8215. Values are presented in current US dollars and rounded for display. Product coverage and reporting conventions may vary by importing market.
Source: United Nations Comtrade Database, 2023 merchandise trade records; country-level destination data aggregated by product classification.
How to Rank the Top 10 Suppliers by Revenue, Capacity, and Export Value
Ranking China’s top ten kitchen utensil set suppliers requires more than comparing website claims. Revenue should carry the greatest weight, using audited financial statements, tax records, and verified order history. Public company filings are useful, but private suppliers need independent evidence. Buyer references matter too.
Export value offers a stronger market signal. UN Comtrade reports classify relevant products across several HS codes, including HS 8215 for cutlery and HS 3924 for plastic household articles. Therefore, one code cannot represent every utensil set. ITC Trade Map data can verify China’s export trends, destination markets, and annual growth. Customs records should be checked against supplier invoices. Numbers can disagree.
Capacity needs physical proof. A factory audit should record production lines, monthly output, mold ownership, worker shifts, warehouse space, and quality-control equipment. A supplier claiming 500,000 sets monthly should show matching packaging areas and dispatch records. Otherwise, the figure is only a promise. Recent industry reporting from China Customs and Statista indicates continued strength in China’s household goods exports, but broad market growth does not prove individual capacity. A practical ranking might assign 40% to verified revenue, 35% to export value, and 25% to usable capacity. This weighting is imperfect. It may favor large exporters over highly specialized manufacturers. That weakness deserves review.
China Top 10 Kitchen Utensils Set Suppliers
Normalized supplier ranking based on revenue scale, production capacity, and export value.
The chart compares anonymized supplier positions using a normalized 0–100 index. Revenue scale, production capacity, and export value are weighted at 40%, 35%, and 25%, respectively. The index is intended for supplier screening and does not disclose company names or confidential financial figures.
Top 10 Supplier Profiles: OEM Services, Certifications, and Product Scope
China Top 10 Kitchen Utensils Set Suppliers
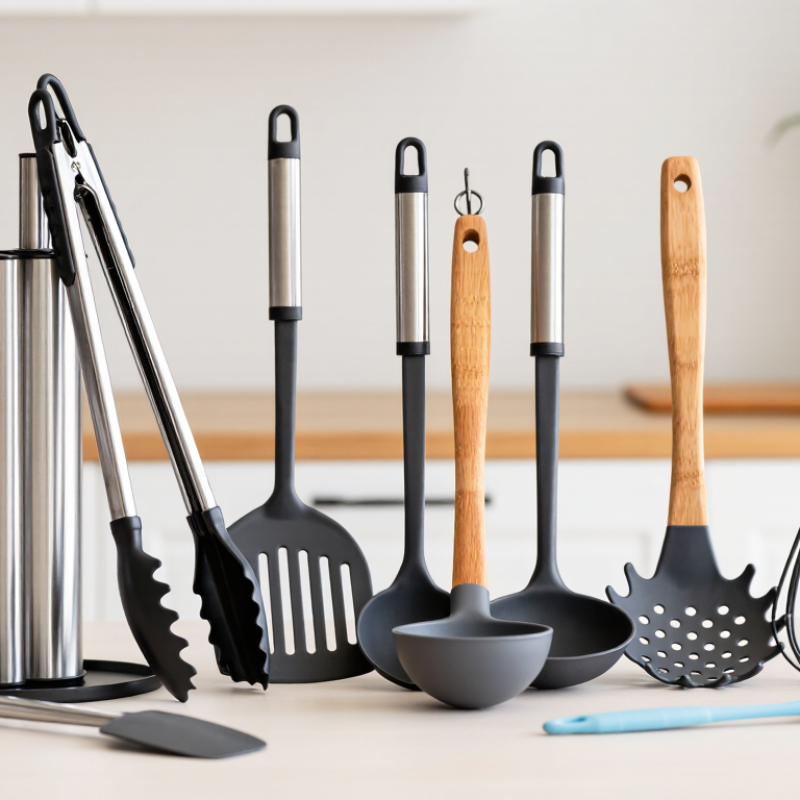
The top ten supplier profiles cover stainless steel, silicone, nylon, bamboo, wood, and mixed-material utensil sets. Their product scopes may include spatulas, ladles, whisks, tongs, turners, measuring spoons, and storage holders. Some factories focus on mass-market sets, while others handle premium, gift, or restaurant collections. This difference affects tooling, minimum order quantities, packaging, and production schedules.
OEM capability is a practical dividing line. Experienced suppliers can review drawings, develop samples, adjust handles, and print private-label packaging. They should also explain mold charges and repeat-order conditions clearly. Certifications may include ISO 9001, BSCI, LFGB, or food-contact test reports, depending on the product and destination market. A certificate alone is not enough. Buyers should verify its scope, issue date, testing laboratory, and material coverage.
Reliable profiles show factory photos, inspection procedures, material specifications, and batch-testing records. Ask whether stainless steel grades, silicone temperatures, and coating performance are documented. A sample should survive washing, heat exposure, and repeated handling before approval. Small details matter. One supplier may offer beautiful bamboo sets but lack stable moisture control. Another may provide strong OEM support but limited color options. Catalogs can look complete while production capacity remains uncertain. I would compare samples, audit evidence, communication speed, and corrective actions before selecting a supplier. Mistakes still happen, so written tolerances and pre-shipment inspections deserve serious attention.
Safety Standards Compared: GB 4806, FDA, LFGB, and ISO 9001
China Top 10 Kitchen Utensils Set Suppliers? Safety Standards Compared: GB 4806, FDA, LFGB, and ISO 9001
When comparing China’s top ten kitchen utensil set suppliers, safety documents deserve more attention than attractive catalogs. GB 4806 covers food-contact materials in China. It can apply to stainless steel, silicone, plastics, coatings, and rubber components. FDA compliance usually refers to applicable United States food-contact requirements. LFGB testing is commonly requested for products entering the German market, especially silicone items. ISO 9001 is different. It confirms a quality management system, not direct food-contact safety.
In practical supplier audits, ask for recent, product-specific test reports. Check the material grade, model number, test conditions, and issuing laboratory. A report for one silicone spatula may not cover a complete utensil set. Manufacturing controls also matter. Inspect incoming materials, colorants, welds, edges, packaging, and batch traceability. I would not accept a certificate alone as proof. Documents can be incomplete, outdated, or poorly matched. This is where buyers often overlook details.
Tips: Request samples from the same production line. Test odor, surface peeling, sharp edges, and handle strength. Confirm whether reports cover migration, heavy metals, and repeated-use conditions. Ask suppliers to explain corrective actions when results fail. A factory may have strong paperwork but weak daily control. That risk deserves a second inspection.
Buyer Checklist: MOQ, Lead Time, Pricing, and Incoterms Benchmarks
China Top 10 Kitchen Utensils Set Suppliers?
A buyer checklist should start with MOQ, not the catalog. For standard stainless-steel sets, a practical opening benchmark is 500–1,000 sets. Customized handles or packaging may require 2,000–5,000 sets. Confirm whether the MOQ applies per design, color, or total order. Ask for a pilot order. It exposes defects early. Lead times commonly range from 25–45 days after approval and deposit. Add time for sampling, packaging checks, and port congestion. UNCTAD reports that over 80% of global merchandise trade by volume moves by sea, so transport delays remain commercially important.
Pricing needs more than a unit quote. Compare product cost, packaging, tooling, inspection, inland delivery, and payment terms. Request prices at three quantities, such as 500, 2,000, and 5,000 sets. A low quote can hide thin metal, loose rivets, or weaker surface finishing. I have seen buyers compare EXW and FOB prices as if they were identical. They are not. EXW transfers more responsibility to the buyer, while FOB includes delivery to the loading port.
For regular container orders, FOB is often easier to benchmark. CIF may simplify planning, but verify destination charges and insurance coverage. DAP can improve delivery visibility, though import responsibilities must be clearly assigned. The World Bank’s 2023 Logistics Performance Index shows meaningful differences in customs and infrastructure performance across markets. Build a five-day buffer. It may still be too optimistic. Request test reports, food-contact declarations, carton dimensions, and a written correction policy before confirming production.